Abstract
Based on Biot’s theory of wave propagation in suspensions the utilization of the
ultrasound technique for the analysis of the setting and hardening of cementitious
materials became very popular over the last years. This is well documented in
numerous papers (for instance: SAYERS & DAHLIN [1993], BOUTIN & ARNAUD
[1995] or D’ANGELO ET AL. [1996]). The Institute of Construction Materials at the
University of Stuttgart - namely Prof. Dr.-Ing. H.-W. Reinhardt - started its
comprehensive research activities in the year of 1991. The most recent result of
this project is the development of an ultrasound device. It is shown in detail that
the method, applied to mortar materials, is able to document and analyze the
setting and hardening process continuously in a way that could not be achieved by
conventional techniques such as the vicat-needle test, the penetrometer test, the
slump test, or rheologic testing methods.
Introduction
Continuous research activities over the last decade are the basis for an ultrasound technique for measurements on time-dependent material properties that has been
developed at the Institute of Construction Materials, University of Stuttgart, under
the direction of Professor Dr.-Ing. H.-W. Reinhardt. This resulted in a measuring
device to investigate the hardening process of cementitious materials in terms of
material properties and quality control as well as in a patent specification which
was passed for registration under number 198 56 259.4 [1999] at the german
patent office (Deutsches Patent- und Markenamt, München). Numerous papers
[GROSSE & REINHARDT 1994; REINHARDT & GROSSE 1996; REINHARDT ET AL.
1996; REINHARDT ET AL. 1999; GROSSE & REINHARDT 1999a] describe the
evaluation of a suitable and applicable measuring technique.
Following the requirements of construction chemicals laboratories, a measuring
system was developed. In the following paragraphs the physical background as
well as some of the specifications are described. At the end some preliminary
results are shown, giving an impression of future applications.
Motivation and physical background
Modern concrete technology faces several challenges:
• there is a great demand by the design engineer for high-strength concrete,
high-performance concrete, fibre concrete;
• contractors are demanding for highly workable concrete, self-levelling
concrete, slip formed concrete, retarded mixes;
• there is less workmanship on the construction site available;
• there is increasing quality required for durable concrete structures in an
agressive environment.
The materials producers have a basket full of admixtures and additions which are
deemed to affect the fresh or the hardened state of concrete. The user is sometimes
inclined to combine various products in order to achieve the maximum success.
However, not all mixtures lead to the expected result.
An advanced process technology needs proper control by reliable and - as much
as possible - objective measurements. A possible solution is the ultrasound
technique, where amplitude-, velocity- and frequency-variations depending on the
age of the mortar can be observed during the hardening process. The property of
cementitious materials are changing from a suspension to a solid during the
stiffening process caused by the hydratation of the cement-matrix. Biot’s theory
[BIOT 1956] describes the physical properties of this class of materials in an
adequate way, as was shown by own measurements [BOHNERT 1996]. Based on
this approach, using wave propagation theory, it became obvious that ultrasound
experiments measuring elastic waves in through-transmission are able to characterize the material during the stiffening process. Although the whole
waveform is representing the material properties, for quantitative analysis
techniques some parameters have to be extracted out of the signals recorded by a
measuring device. Parameters that are easy to determine are the velocity
(extracted by measuring the onset time of the signals knowing the travelpath of
the wave), the energy (calculating the integral sum of the wave amplitudes) and
the frequency content (using Fast-Fourier-Transform techniques). One has to keep
in mind that there are, of cause, also several other parameters that can be used.
Even though one single wave parameter could be sufficient to characterize the
material, the reliability of the method in increased by evaluating more than one.
In the following the application of the method in a certain field of interest is
shown.
Specifications for mortar measurements
The ultrasonic testing device freshmor 1 was developed at the University of
Stuttgart, Institute of Construction Materials. It enables the observation of the
setting and hardening process of mortar by means of ultrasonic throughtransmission.
Ultrasonic velocity and transmitted energy are the parameters that
are evaluated. The testing device, shown in figure 1, consists of a personal
computer with an A-D-conversion card, an ultrasonic generator, a mould with an
ultrasonic emitter/transducer pair and cables and connectors.
Since mortar contains no aggregates, the size of the mould could be reduced
significantly compared to former measurements on concrete materials
[REINHARDT ET AL. 1999]. The advantages are a better handling of the mould, a
smaller amount of material lost during the measurement, as well as less waste
causing additional costs.
The shape of the mould was designed to meet the following specifications:
• Robustness (using the mould repeatedly in laboratories),
• easy handling and fast replacement of specimen material,
• suppression of interferring waves through the walls of the container,
• mounting for piezoelectric transducers with reproducable coupling to the
tested material. Fig. 1: Set-up for the mortar experiments showing the mould (rubber foam and PMMA-walls) and
the transducers.
An emitter-receiver pair of broadband conical transducers were chosen, which are
sensitive in a frequency range of 20 to 300 kHz. The conical shape of the
transducers enables the possibility of point-to-point measurements.
The signals measured during the stiffening process are recorded by an A/Dconcersion
device consisting of a fast A/D-transientrecorder PC-card controlled
by an IBM-compatible PC. On the emitting side, the signals are produced by an
US-generator via the conical transducer in time intervalls defined by the user.
Apart from the hardware, a lot of efford was made to bring the software in a userfriendly
laboratory-suited state. The software consists of three parts including the
control and monitor software used during the data acquisition, the extraction of
wave parameters used for the material characterization and the data analysis
software.
A list of software features was widely discussed with our research partners:
• Data acquisition and parameter extraction during a routine test as well as a
step-by-step parameter extraction in certain special applications (unknown
products or product components),
• waveform acquisition and recording with adequate amplitude resolution,
• automatic onset time picking with the highest reliability,
• flexible measurement intervals according to different periods of interest for
different admixtures,
• automatic processing of the signals including velocity and energy evaluation
during and after the test,
• extraction of additional material relevant parameters such as initial and final
setting time of the mortar.
Under the auspices of Professor Dr.-Ing. H.-W. Reinhardt the authors worked
together to meet all requirements including hardware and software as described in
the following.
Experimental setup and first results
Not all steps of the development can be described in detail. It was an iterative
process of finding a suitable shape for the mould. The final container has two
walls of PMMA and a U-shaped rubber foam. According to the description in the
patent specification [1999].
Some effort had to be done to fulfill all requirements regarding the software. An
important feature was the implementation of a dynamic software amplifier, which
was realized to enhance the amplitude resolution. The ultrasound waves travelling
through the mortar are highly attenuated in the beginning right after mixing. The
signal in the hardenend state, is however several decades higher in amplitude.
This significant increase in amplitude is a problem when using a device with 12-
bit hardware amplitude resolution without a gain ranging method.
To determine automatically the onset times of the compressional waves and
therefore the velocities with highest reliability, a special picking algorithm must
be used. Well-known algorithms using the crossover of signals above a given
threshold are not applicable in this case, because, for the given data, they were
tested with errors of over 100 percent in relation to the onset times. We have
developed a software called FreshCon which uses a combined energy-frequency
approach solving this problem. The algorithm was very well tested in numerous
applications and gives reasonable results even if the signal-to-noise ratio is low.
An example is shown in figure 2. A description of the software can be found in
GROSSE & REINHARDT [1999b]. Fig. 2: Example of an unfiltered US-signal in FreshCon using the semiautomatic picking mode.
For the final data analysis we used a comercially available software tool called
Origin (from MicroCal), which we have considerably modified with import
filters, templates, and macros. To give an impression of it‘s capabilities, figure 3
shows a typical sheet of data evaluation. The solid line is the calculated
compressional wave velocity depending on the age of mortar and the dotted line
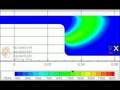
shows the energy. Fig. 3: Data analysis using the FreshMor-templates in the Origin-software. The straight lines at 2 h
39 min and 5 h 30 min give the values of the initial and final setting time of the material.
The operator is able to give a title for the sheet according to the tested material or
the date and time. In addition he may extract automatically the values of the initial
and final setting time of the mortar marked by two straight lines at certain ages.
Import and export of data as well as the print and documentation options are using
the latest MS-Windows standards including OLE-features for test documentation
with standard text processors.
First results
The first measurements have been conducted to test the reproducability of the data
curves. For these experiments, mortar mixtures consisting of a standard sand,
standard grain-size (∅ 0-2 mm) and water-to-cement ratio (no admixtures) have
been chosen. Three identical mixtures were tested – one after another. For the
mixing process itself we stood to the standard procedure for prisms according to
DIN EN 196-1, including a compaction time of two minutes. During this vibration
of approximately 0.7 mm horizontal amplitude, the mould was slowly be filled –
we learned that the devaporation of the material is important for proper and reliable results. Due to the time necessary for compaction and connection to the
US-device, the first data can be recorded after approximately 10 minutes. The
graphs in figure 4 demonstrate that the reproducability of the velocity and the
energy data are reasonable. Choosing standard settings for these test measurements,
the repetitive data acquisition interval was set to 10 minutes. For all
experiments described in this paper, the waveforms were averaged of five single
measurements, that is why every data point of the velocity and energy curves
represents five recordings. This procedure enhences the reproducability
condiderably. The variations at the end of the curves at later ages result from the
lower resolution according to shorter traveltimes in the hardenend material. Fig. 4: Reproducibility test evaluate velocity and energy curves of three mortar mixtures of the same
kind.
 Fig. 5: Velocity (sligthly smoothed) versus age of mortar for 4 different mixtures.
The ultrasonic device presented in this article is able to extract automatically
certain parameters of US waves recorded continously during the setting and
hardening of mortar materials. The resulting curves describe the material
behaviour and are related closely to the hydration process of the mortar. These
curves are linked to the elastic properties and give a comprehensive picture of the
stiffening process in a way that was not accessible before. Future applications in
industrial laboratories have to show, what kind of benefits are brought up by
recording the material properties of suspensions during hardening. Anyway, it is
obvious that this technique gives a clearer and more detailled insight than the
standard procedures that are measuring only one single parameter at certain
stiffness stages.
It is expected that the industrial use of this method will feedback in a further
improvement of the technique examining mortar materials. On the basis of these
experiences, the existing apparatus for concrete investigations will also be improved to enable measurements in-situ. It should be concluded, that apart from
this, the US-device will be modified for measurements on different other materials
such as polymers, ceramics or even starch.
The presented work is the result of a scientific project where many scientist and
students took part. The authors like to thank Jochen Fischer [1991], Nicole
Windisch [1996], Iris Kolb [1997] and Jens Bohnert [1996] for their
contributions. A very special thank-you is expressed by the authors to Prof. Dr.-
Ing. H.-W. Reinhardt for the initiation of this project, innumerable discussions
and his proficient and detailed help in all kind of problems. Without his efforts
and inertia, this research would not have been possible.